In today’s world of big data and fast-paced technological progress, the ability to analyze and interpret data is essential for informed decision-making and driving innovation. Python, celebrated for its ease of use and flexibility, has become the go-to programming language for data analysis. Its rich ecosystem of libraries empowers users to efficiently handle tasks ranging from data manipulation and visualization to advanced statistical modeling and machine learning. This guide delves into the top 10 Python libraries for data analysis, offering powerful and scalable tools for both beginners and seasoned professionals to address modern data challenges.
Table of contents
1. NumPy
NumPy is a cornerstone of numerical computing in Python, serving as a fundamental library for data analysis. It supports large arrays and matrices while offering a robust suite of mathematical functions to manipulate these structures.
Advantages:
- Handles large datasets efficiently with multidimensional arrays.
- Provides extensive tools for operations such as linear algebra and Fourier transforms.
- Seamlessly integrates with libraries like Pandas and SciPy.
Limitations:
- Limited high-level data manipulation features.
- Relies on Pandas for labeled data handling.
import numpy as np# Creating a 1D array and performing operationsdata = np.array([10, 15, 20, 25, 30])print("Array:", data)# Calculating the sum and finding the minimum valueprint("Sum of elements:", np.sum(data))print("Minimum value:", np.min(data))
Output
2. Pandas
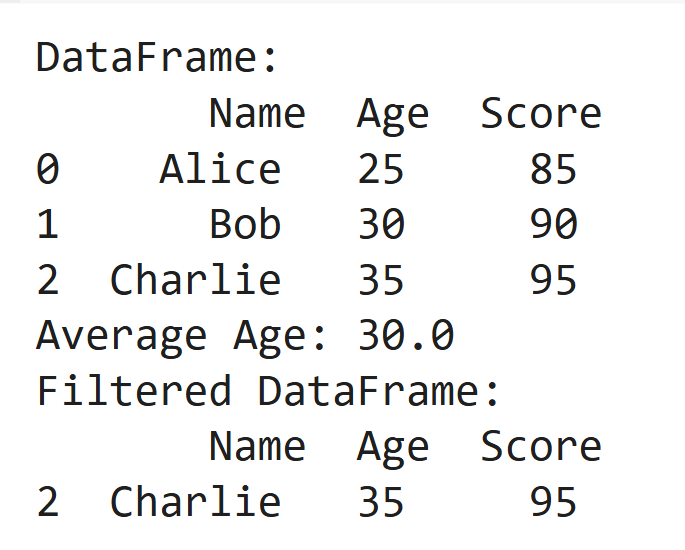
Pandas is a powerful library for data manipulation and analysis, offering DataFrames to work effortlessly with tabular data. It simplifies the process of cleaning and managing structured datasets.
Advantages:
- Streamlines data preprocessing and transformation tasks.
- Provides advanced functions for merging, filtering, and grouping data.
- Integrates seamlessly with NumPy for numerical operations.
Limitations:
- Performance can lag with extremely large datasets.
- High memory usage when handling big data.
import pandas as pd

# Creating a DataFrame
data = pd.DataFrame({
    'Product': ['Laptop', 'Tablet', 'Smartphone'],
    'Price': [1200, 300, 800],
    'Stock': [50, 150, 100]
})
print("DataFrame:\n", data)

# Data manipulation
print("Total Stock:", data['Stock'].sum())
print("Products Over $500:\n", data[data['Price'] > 500])
Output
3. Matplotlib
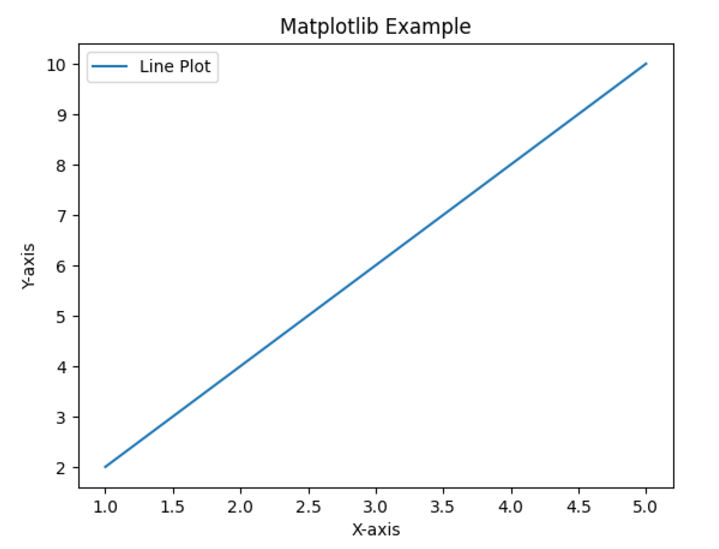
Matplotlib is a versatile plotting library used to create static, interactive, and animated visualizations in Python.
Advantages:
- Offers highly customizable visualization options.
- Forms the foundation for advanced libraries like Seaborn and Pandas plotting.
- Supports a wide variety of plot types, including line, scatter, and bar charts.
Limitations:
- Can have a steep learning curve for complex visualizations.
- Aesthetics are less refined compared to newer visualization libraries.
import matplotlib.pyplot as plt

# Data for plotting
categories = ['A', 'B', 'C', 'D']
values = [15, 30, 45, 10]

# Plotting
plt.bar(categories, values, color='skyblue')
plt.xlabel('Categories')
plt.ylabel('Values')
plt.title('Bar Chart Example')
plt.show()
Output
4. Seaborn
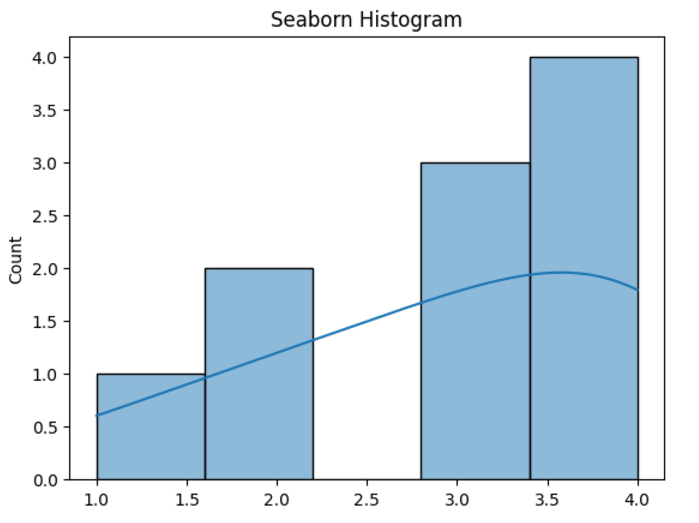
Seaborn is a Python library for data analysis that builds on Matplotlib, offering an easy way to create statistical visualizations with visually appealing aesthetics.
Advantages:
- Enables the creation of attractive, polished plots with minimal effort.
- Offers built-in themes and color palettes for enhanced visual appeal.
- Simplifies complex statistical plots such as heatmaps and pair plots.
Limitations:
- Depends on Matplotlib for its underlying functionality.
- Offers less customization flexibility compared to Matplotlib.
import seaborn as sns
import matplotlib.pyplot as plt

# Sample data
data = {'Category': ['A', 'B', 'C', 'D'], 'Values': [10, 20, 15, 25]}

# Creating a bar plot
sns.barplot(x='Category', y='Values', data=data)
plt.title('Seaborn Bar Plot')
plt.show()
Output
5. SciPy
SciPy is an extension of NumPy, offering advanced tools for scientific computing, including modules for optimization, integration, and signal processing.
Advantages:
- Provides a wide range of tools for scientific and technical tasks.
- Well-documented with numerous practical examples.
- Seamlessly integrates with NumPy and Pandas for streamlined workflows.
Limitations:
- Requires knowledge of scientific computing concepts.
- Lacks functionality for high-level data manipulation.
from scipy.stats import ttest_ind

# Sample data
group1 = [1, 2, 3, 4, 5]
group2 = [2, 3, 4, 5, 6]

# T-test
t_stat, p_value = ttest_ind(group1, group2)
print("T-Statistic:", t_stat)
print("P-Value:", p_value)
Output
6. Scikit-learn
Scikit-learn is a versatile machine learning library that provides tools for classification, regression, clustering, and other key machine learning tasks.
Advantages:
- Features a user-friendly API and well-documented functions.
- Offers a wide range of prebuilt machine learning algorithms.
- Integrates seamlessly with Pandas and NumPy for efficient workflows.
Limitations:
- Lacks support for deep learning models.
- Not suitable for large-scale distributed training scenarios.
from sklearn.tree import DecisionTreeClassifier

# Data
X = [[0, 0], [1, 1], [1, 0], [0, 1]]  # Features
y = [0, 1, 1, 0]                      # Target labels

# Model
model = DecisionTreeClassifier()
model.fit(X, y)
print("Prediction for [1, 0]:", model.predict([[1, 0]])[0])
Output
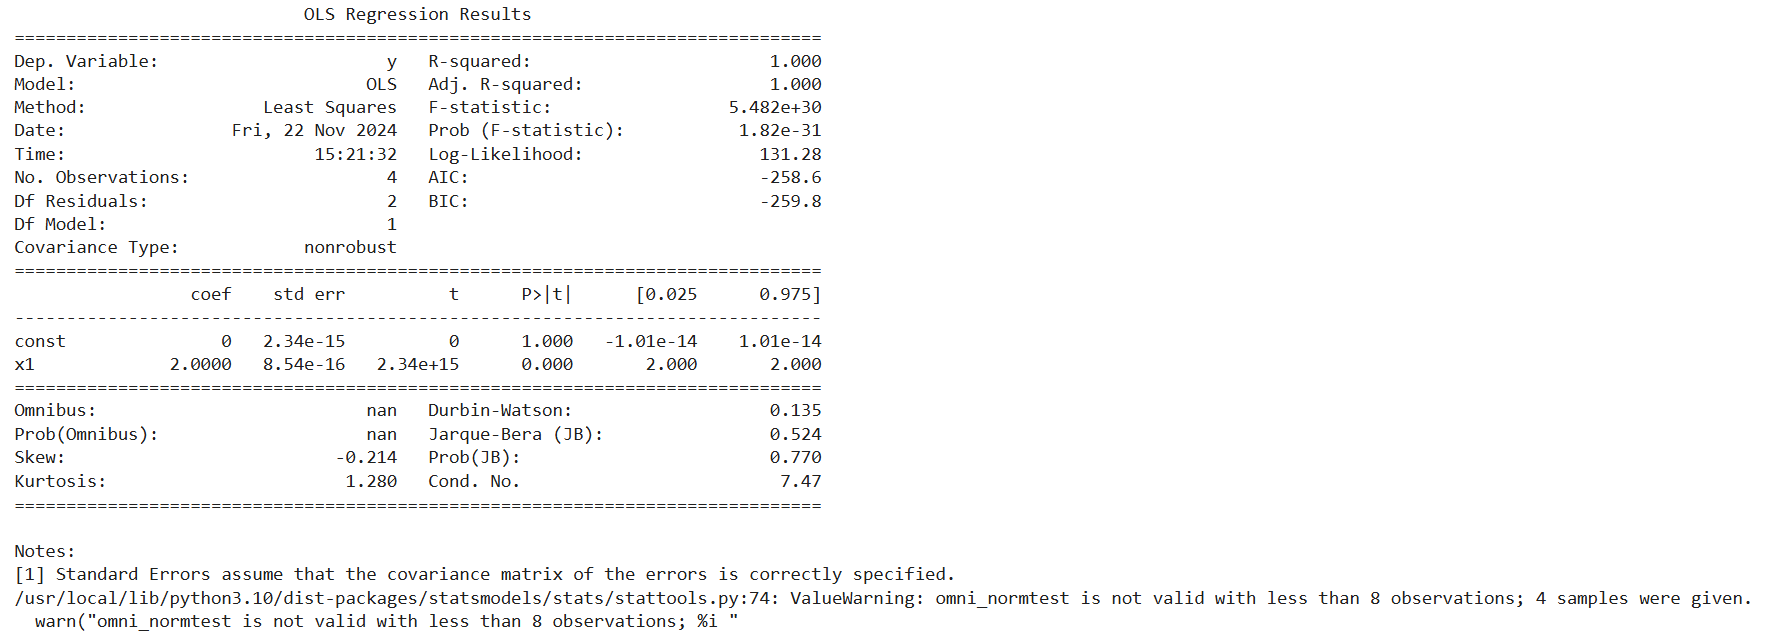
7. Statsmodels
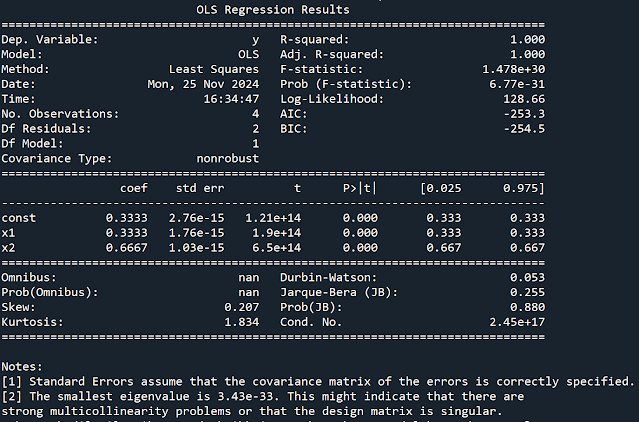
Statsmodels is a Python library designed for statistical modeling and hypothesis testing, offering tools for linear models, time series analysis, and more.
Advantages:
- Well-suited for econometrics and statistical research.
- Provides detailed output for statistical tests and models.
- Strong emphasis on hypothesis testing and inference.
Limitations:
- Has a steeper learning curve, especially for beginners.
- Slower than Scikit-learn for tasks focused on predictive modeling.
import statsmodels.api as sm

# Data
X = [[1, 2], [3, 4], [5, 6], [7, 8]]  # Features
y = [2, 4, 6, 8]                      # Target
X = sm.add_constant(X)  # Add constant for intercept

# Model
model = sm.OLS(y, X).fit()
print(model.summary())
Output
8. Plotly
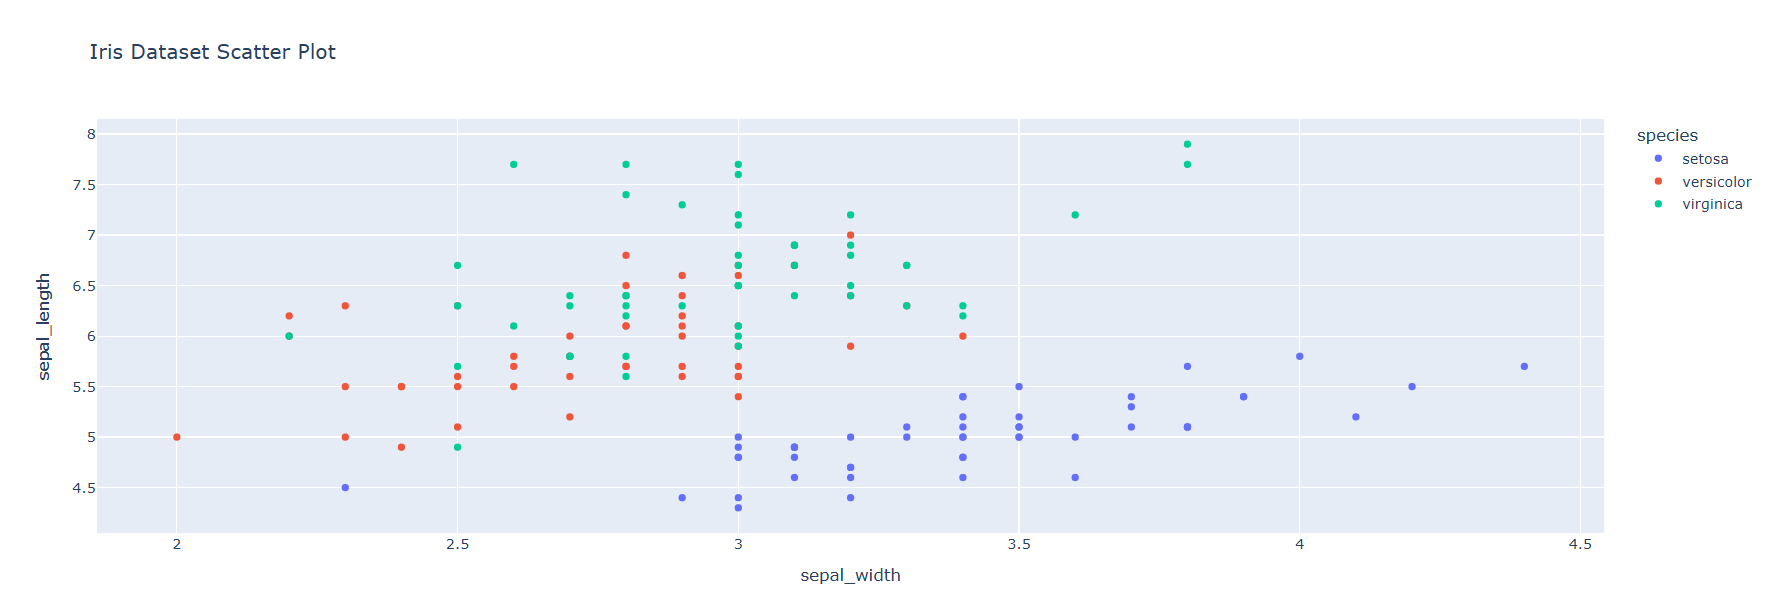
Plotly is a powerful library for creating interactive and web-based visualizations, ideal for dynamic dashboards and data presentations.
Also Read: Introduction to Data Visualization with Plotly in Python
Advantages:
- Offers interactive, responsive visualizations that enhance user engagement.
- Seamlessly integrates with web applications for real-time data visualization.
- Supports advanced chart types, including 3D plots and geographic visualizations.
Limitations:
- Can be demanding on browser memory with large datasets.
- May need additional setup and configuration when deploying on production systems.
import plotly.express as px

# Sample data
data = px.data.gapminder()

# Scatter plot
fig = px.scatter(data, x="gdpPercap", y="lifeExp", color="continent", size="pop",
                 hover_name="country", title="Gapminder Dataset: GDP vs Life Expectancy")
fig.show()
Output
9. PySpark
PySpark is the Python API for Apache Spark, designed to facilitate large-scale data processing and distributed computing.
Advantages:
- Efficiently handles and processes big data.
- Seamlessly integrates with Hadoop and other big data technologies.
- Supports machine learning tasks through MLlib.
Limitations:
- Requires a configured Spark environment to operate.
- Has a steeper learning curve, especially for those new to big data processing.
!pip install pyspark

from pyspark.sql import SparkSession

# Initialize Spark session
spark = SparkSession.builder.appName("PySpark Example").getOrCreate()

# Create a DataFrame
data = spark.createDataFrame([(1, "Alice"), (2, "Bob")], ["ID", "Name"])
data.show()
10. Altair
Altair is a declarative statistical visualization library built on Vega and Vega-Lite, designed for simplicity and clarity in creating visualizations.
Advantages:
- Provides an intuitive syntax for generating complex visualizations.
- Integrates seamlessly with Pandas for efficient data plotting.
Limitations:
- Offers less interactivity compared to libraries like Plotly.
- Struggles with handling very large datasets without preprocessing.
import altair as alt
import pandas as pd

# Simple bar chart
data = pd.DataFrame({'Category': ['A', 'B', 'C', 'D'], 'Value': [8, 12, 20, 5]})
chart = alt.Chart(data).mark_bar().encode(x='Category', y='Value')
chart.display()
Output
Also Read: 10 Essential Python Libraries for Every Data Analyst
Conclusion
Python's extensive library ecosystem makes it a leading choice for data analysis, offering solutions for tasks ranging from data cleaning and preprocessing to complex statistical modeling and interactive visualizations. For beginners, foundational libraries like NumPy, Pandas, and Matplotlib provide an excellent starting point, while advanced users can harness the power of tools like Scikit-learn, PySpark, and Plotly for scalable and sophisticated analyses.
Selecting the right library depends on your specific task, the size and complexity of your dataset, and the desired analysis outcomes. By combining usability with seamless integration, Python empowers users to derive meaningful insights, making it an indispensable tool in today’s data-centric world.
More in this topic
- TensorFlow Basics for Beginners Step-by-Step Python Guide
- K-Means Clustering in Machine Learning: A Beginner's Guide with Examples
- Learning Python for Beginners Best Python Module String 2024
- Learning Analytics Methods and Tutorials: A Practical Guide Using R
- Top 7 Free Data Science Plateforms for Beginners in 2024


